Following on the heels of my post on Globalization in the Pharmaceutical Industry, it is also useful to examine the distribution of inventorship across the United States. The stakes aren’t quite as high here — public health and national security don’t come in to play — but there still are important implications for economic development.
Using the same methodology, assigning relative inventorship of the patents from each year’s approved drugs from 2000 through 2010 (source: www.DrugPatentWatch.com), I focused on US inventors and examined the distribution by state.
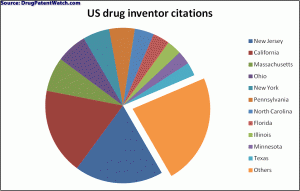
1: New Jersey and California lead the nation
There aren’t too many surprises at the top of the list; one would expect New Jersey, California, and Massachusetts to top the list. Going further down the list shows strong activity in states that might not get the attention they deserve as leaders of pharmaceutical innovation.
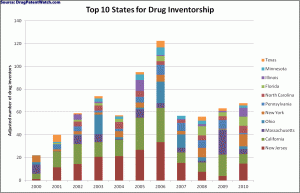
2: Some states show surprising volatility
While the patenting activity in states like New Jersey and California seems relatively stable year-over-year and fairly tracks the graph’s overall trend, there is great volatility in other states. Massachusettts and Ohio, for example, show sharp spikes in absolute and relative terms. This activity merits additional investigation, and is potentially an opportunity for regional economic development authorities to identify and support the activities enabling the spikes.
You can also get more detailed information on the complete set of drug inventors and where they live in my United States Drug Patent Inventor Report. A Global Drug Patent Inventor Report and other Individual Country Drug Patent Inventor Reports are also available.
What do you think of the findings? Are you surprised? Do you disagree? Sound off in the comments.

